
Compare time periods
Use date ranges to see whether spending is rising, falling or simply concentrated in a few expensive days.
Choose a date range and see which days, categories and merchants account for most of your spending.
Start for freeCharts are useful only when you can understand what created them. Your analytics are based on saved expenses and categories, so you can move from a high-level trend back to the purchases behind it.
Recognition saves typing, but you remain in control. Before saving, you can correct products, prices, merchant information and categories. Manual expenses are available for purchases that do not have a receipt.
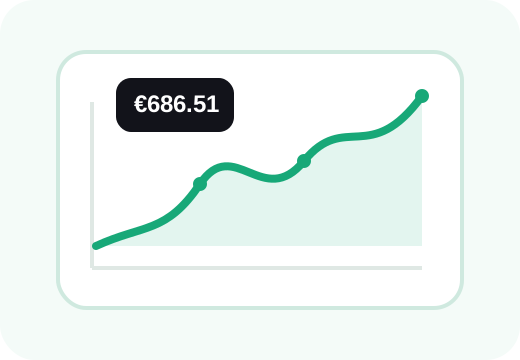
Use date ranges to see whether spending is rising, falling or simply concentrated in a few expensive days.
Focus on one or several categories without losing the rest of your history. This is useful for groceries, transport, home costs and custom groups.
Discover which merchants receive the largest share of your spending and on which weekdays you tend to spend more.
Start building a spending history that is searchable, categorized and much easier to understand than a pile of receipts.
Are you sure you want to continue?